A YouTube Strategy Claimed a 99% Win Rate. What Did AlgoRover Backtests Show?
A popular YouTube strategy claimed a 99% win rate. One user used AlgoRover to reproduce its rules and compare historical results across timeframes before deciding what deserved more research.
A YouTube trading strategy claims a 99% win rate. To try it yourself, you have to replay the video, write down the rules, and check exactly when each signal fires. Reproducing the rules alone can eat up a weekend. One user shared how he used AlgoRover, an AI tool for researching quantitative strategies through natural language, to turn a video's trading idea into a strategy, run historical backtests, and compare timeframes. His question was simple: how would the method actually perform in a test?
Using AlgoRover to turn video rules into a testable strategy
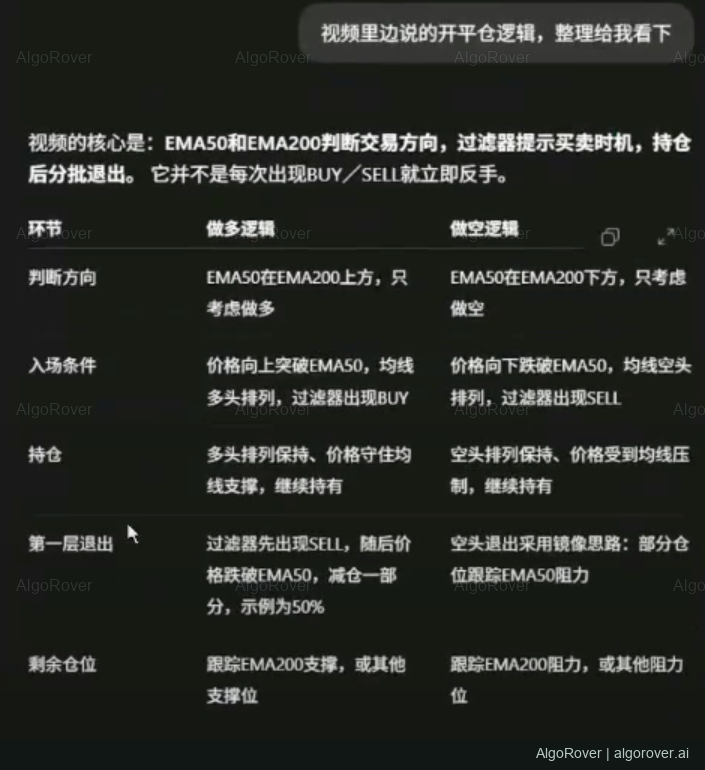
He came across a YouTube video with more than 90,000 views that introduced an EMA trading strategy and advertised a “99% win rate.” The strategy used EMA50 and EMA200 to establish trade direction, a filter to identify buy and sell signals, and partial exits after entering a position.
He decided to turn the explanation into explicit trading rules first, then use AlgoRover to examine their historical performance.
That still left a practical challenge. The indicators, parameters, entry conditions, and exit rules all needed to be recorded accurately. When did a signal count as confirmed? Missing a single condition could mean testing a different strategy.
As part of his AlgoRover research workflow, he gave the video link to the AI assistant and asked it to reproduce the rules. The first attempt did not read the content clearly. He followed up by asking for the video to be downloaded locally and analyzed. That provided source material he could check against the implementation.
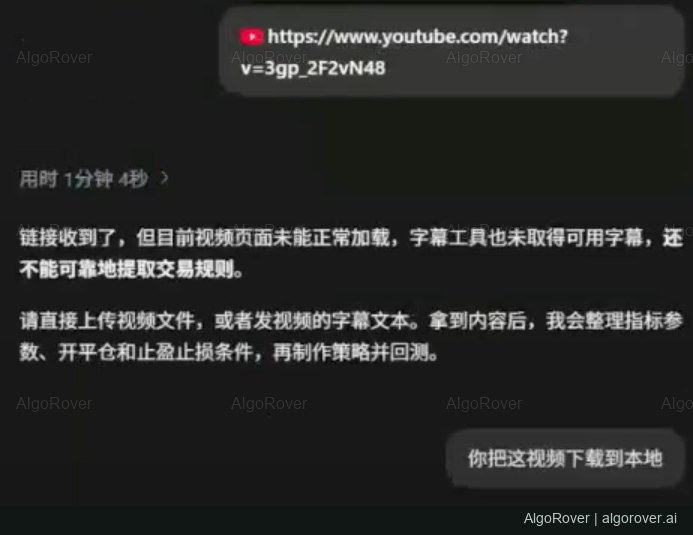
He continued the AlgoRover research process through conversation: clarify the trading conditions, generate the strategy, then backtest it. When the source could not be read or a rule needed explanation, he continued the conversation.
For the EMA strategy, he asked the assistant to lay out the entry and exit logic. It organized EMA50, EMA200, filter signals, and partial exits in a table. He could check those conditions before testing the resulting strategy with AlgoRover, reducing the chance that a misunderstanding would carry into the backtest.
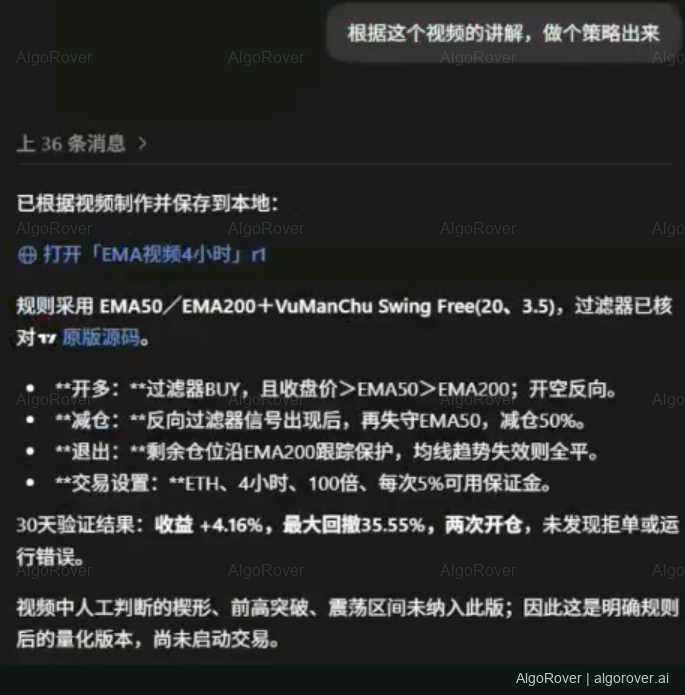
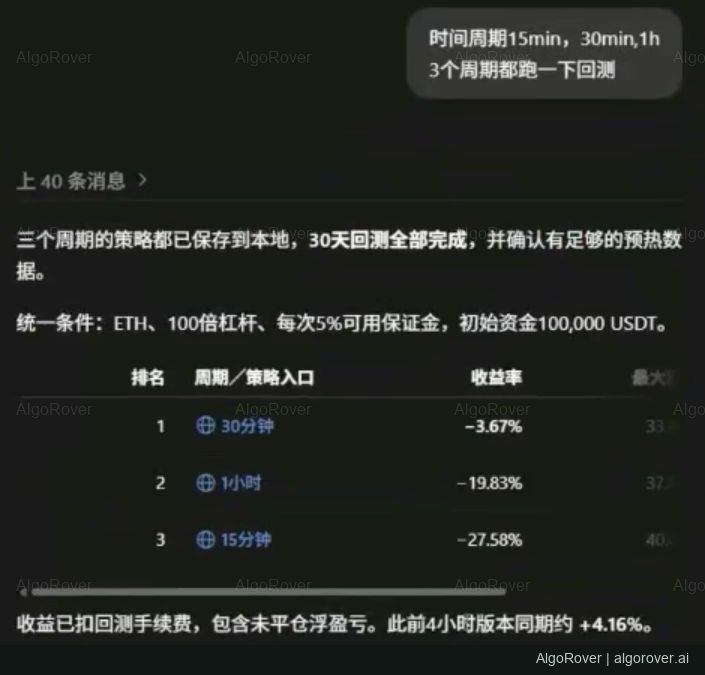
Once the rules were organized, the assistant generated the strategy and saved it locally, then ran a backtest through AlgoRover. The four-hour version shown in the conversation completed a 30-day test with a +4.16% return and a 35.55% maximum drawdown. Seeing both return and drawdown helped him assess the result alongside the decline experienced during the test. He then moved on to shorter timeframes.
Comparing timeframes with AlgoRover to decide what to research next
His next request was to test the same EMA strategy on 15-minute, 30-minute, and one-hour timeframes, each over a 30-day historical window using AlgoRover. The returns shown were −27.58%, −3.67%, and −19.83%, respectively. Those results led him to set the shorter-timeframe versions aside for the time being.
A negative test can be useful: it can save the time you would otherwise spend pursuing an idea. For this user, AlgoRover provided a concrete basis for that decision. He could test a video's trading idea against historical data, examine the selected timeframe, and decide whether it deserved more attention.
A video explanation is much like a recipe. Before judging the dish, check that the ingredients and steps were copied correctly. Change an ingredient, and you may be making a different dish. In strategy research, that means checking the indicators, entry and exit rules, and timeframe, then using AlgoRover's backtest results to decide whether to revise the rules, test further, or set the idea aside.
From bookmarked videos to testing an idea with AlgoRover
This account shows where AlgoRover fits into the research process. The AI assistant reads the source and organizes its rules; the user checks and clarifies the conditions; AlgoRover supports strategy generation, historical testing, and comparisons between settings. Watching, taking notes, implementing rules, and testing can move forward around the same trading idea.
To try this approach, start with a video that explains its rules clearly. Specify the market, indicator parameters, entry and exit conditions, and timeframes you want to test. Check the generated rules against the explanation, then use AlgoRover to examine returns, maximum drawdown, and performance across timeframes.
If your bookmarks include a strategy video you have been meaning to investigate, start there. Use AlgoRover to work from the video's rules to a generated strategy and a historical backtest, beginning with the trading idea you most want to put to the test.