Keltner Channel Strategy: Buy the Breakout or Wait for a Pullback?
An upper-band touch does not tell you whether to buy. Follow one complete Keltner breakout, see what the settings change, and check the orders after the signal.
Price reaches the upper Keltner band. Do you buy now or wait for a pullback? Buying a breakout aims to catch further gains; waiting for a pullback aims for a lower entry during an uptrend. Decide which opportunity you want to trade, then define when to buy and when to sell.
A Keltner channel’s middle line follows average price, while ATR sets the distance to the outer lines. An upper-band touch tells you where price has reached; your trading rules still decide when to buy and sell. Following one trade from entry to exit makes that distinction easier to see.
What are the three Keltner channel lines?
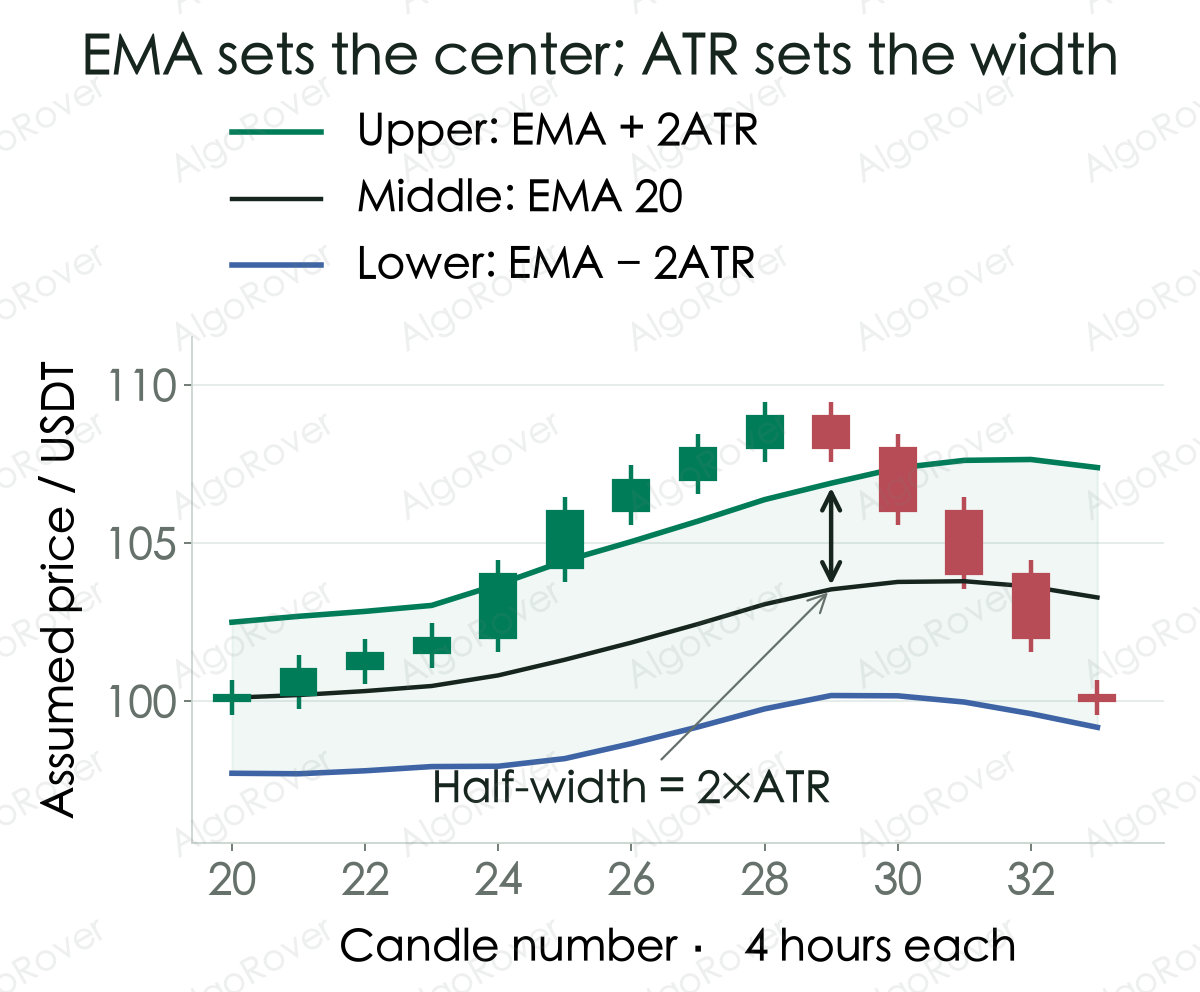
Think of the channel as a running track that moves along with price. The middle line marks its center, with a boundary drawn on each side. When recent price swings grow, the track widens; when they shrink, it narrows. These are painted reference lines, so price can cross them. You still need to see what it does afterward.
Suppose you’re looking at four-hour candles with a 20-period EMA of closes down the middle and a 10-period ATR measuring volatility. Place each outer band twice that ATR away from the EMA: add it for the upper band and subtract it for the lower. TradingView’s KC settings let you adjust these inputs separately. If another platform draws different lines, start by checking whether it uses the same calculation.
EMA is an average that pays more attention to recent prices. A fresh move affects it more, while the influence of older prices gradually fades. ATR measures the size of price movements and averages them across candles.
Suppose the previous candle closed at 100, and the next candle has a low of 105 and a high of 106. Its own high-to-low range is only 1, but price jumped above 105 from that earlier close of 100. Its true range is 6. ATR includes that gap, and ATR 10 averages those movements over time.
Suppose the EMA is 100 USDT and ATR is 1.5 USDT after a candle closes. The upper band is 103 and the lower band is 97. That gives you reference levels. Deciding what happens when price reaches them is a separate rule.
Should you buy when price touches the upper band?
| Your aim | What else must happen? | What can get confused? |
|---|---|---|
| Follow an upward breakout | For example, wait for a close crossing above the upper band while the middle line rises | An intrabar touch happens before a confirmed close |
| Buy a pullback in an uptrend | Define the pullback level and the recovery condition, such as returning near EMA and closing back above it | Falling back inside the channel alone does not complete an entry rule |
If you buy because you expect a breakout to keep going, then sell at the upper band, two different ideas are driving the same trade. Write down what you are waiting for before buying and what would make you sell. Changing one of those decisions at a time makes the difference easier to track.
A Keltner channel strategy: confirm at the close, order next bar
Suppose you want to buy a spot breakout, one unit at a time, with enough cash available and no additions while holding. Two decisions still need an answer: what counts as a breakout, and what makes you sell afterward?
- Let the historical data produce valid EMA 20 and ATR 10 values before checking an entry.
- While you hold no units, look for a previous close that had not exceeded its upper band, followed by a close strictly above its current upper band. The middle line must also be higher than it was on the previous candle.
- Wait for the next candle to begin before submitting the buy. Assume a fill at its opening price, before fees.
- Once you own the unit, wait for a close below the middle line, then submit the sell at the next candle’s start. A close exactly on the line leaves you holding.
Each comparison waits for the candle to finish. If you have used a Donchian breakout rule, remember that its upper line uses a period’s highest price. A Keltner upper line uses EMA plus ATR, so copying the entry condition across needs care.
In our assumed prices, candle 23 closes at 102, below its upper band of about 103.02. Candle 24 closes at 104, above its band of about 103.68, while EMA is rising. The entry signal is now valid. At the start of candle 25, assume one unit fills at 104.2 USDT. The signal close of 104 was not the fill.
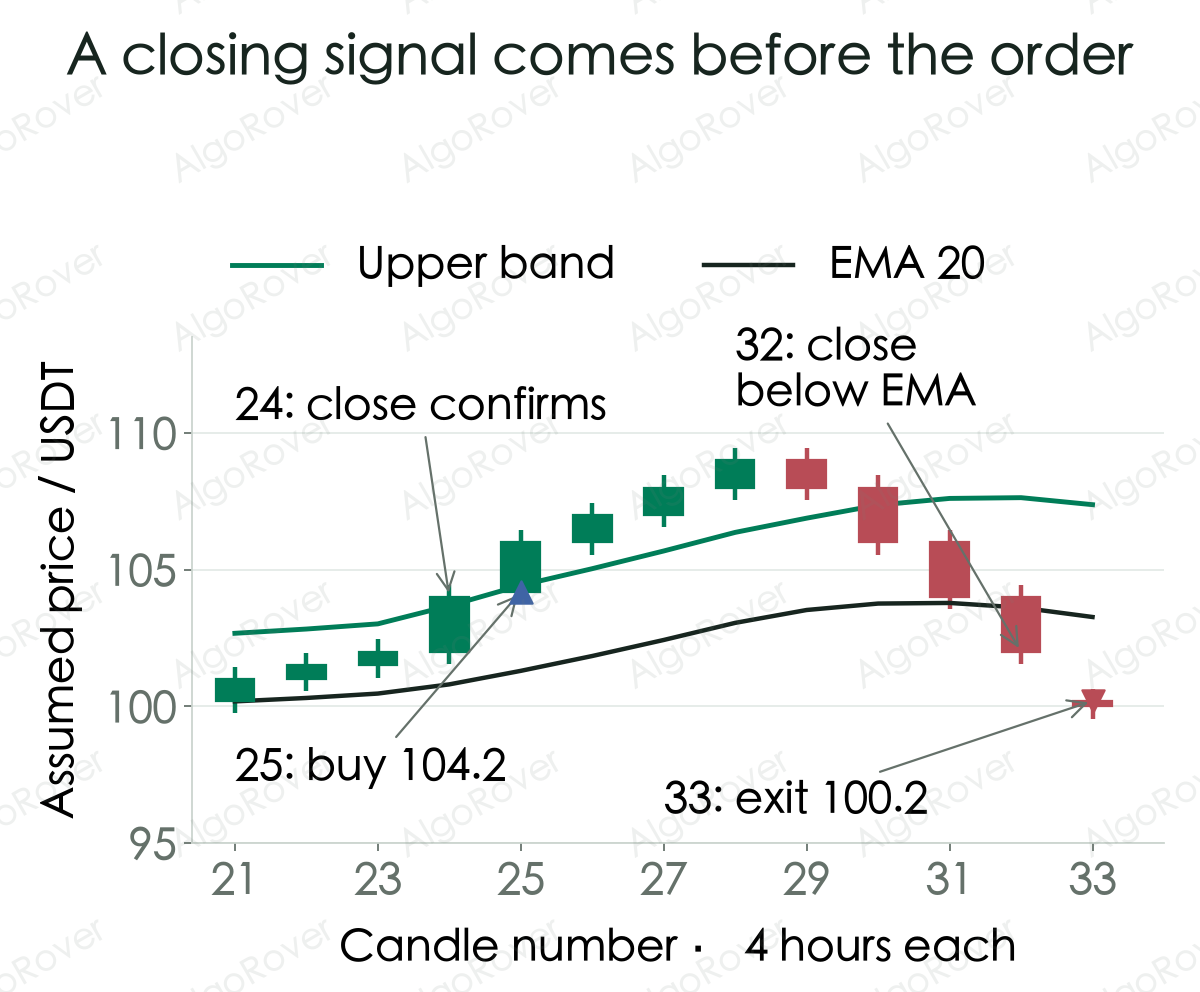
Price later reaches around 109, but the rule keeps holding because it waits for a close below the middle line. Candle 32 closes at 102, below EMA at about 103.62. Assume an exit at 100.2 at the start of candle 33. You paid 104.2 and received 100.2, losing 4 USDT on one unit before fees. A profit shown during the trade can disappear before you sell.
This rule waits for closes. A mid-candle move through EMA does not immediately close the position. Adding a fixed stop or an intrabar protective order requires an explicit trigger, order type and treatment of the event sequence within a candle.
Keltner channel settings: what does each parameter change?
| Parameter | Smaller | Values shown | Larger |
|---|---|---|---|
| EMA length | 10: the middle follows recent prices more closely | 20: checks direction and when to sell | 40: one new close moves the middle less |
| ATR length | 5: a new large move has more influence | 10: each update gives the new true range one-tenth of the weight | 20: a single large move has less influence |
| Multiplier | 1.5: a lower upper band with other inputs unchanged | 2: add twice ATR to the middle | 2.5: a higher upper band with other inputs unchanged |
With EMA still at 100 and ATR at 1.5, multipliers of 1.5, 2 and 2.5 produce upper bands of 102.25, 103 and 103.75. That establishes how the threshold moves. Trade count and net return still depend on the full sequence of positions, exits and costs.
The chart’s EMA starts with the average of the first 20 closes, then mixes the old value and the new close in a 19-to-2 ratio. ATR starts with the average of the first 10 true ranges, then combines nine parts old value with one part new true range. The close before candle 1 is assumed to be 100. For your own backtest, load earlier history so the lines can get going before the period you want to inspect.
When does this breakout rule make sense?
- ✅ A breakout that continues higher: price has room to extend while closes stay above the middle line.
- ⚠️ A sharp rise followed by a fast reversal: waiting for the close and the following order can delay both entry and exit, giving back unrealized profit.
- ❌ Repeated breaks inside a narrow range: buying and exiting can repeat while fees accumulate. A narrow channel does not ensure the next move will trend.
These are implications of the rules, not measured performance claims. Fix the market, period, fees and sizing before comparing settings, and retain the losing stretches as well as the attractive breakout.
Keltner channels vs Bollinger Bands
Both draw boundaries around price, but they measure the track’s width differently. Keltner channels use ATR to measure the size of candle-to-candle movements. Traditional Bollinger Bands use standard deviation to measure how spread out the closes are around their average. The middle-line calculation can differ too. StockCharts’ Keltner guide describes the familiar EMA 20 and ATR 10 settings.
Compare complete rules with stated entry, exit, interval and fees. Which line gets touched first cannot establish which strategy makes money. Calling one indicator “safer” does not replace that comparison.
Common questions
Does an upper-band touch mean overbought and sell?
If you’re holding under the breakout rule above, wait for a close below EMA before scheduling the sell. An upper-band touch leaves the position open. If you prefer taking profit there, test that change separately and compare the trades it changes.
Does EMA 20 on a four-hour chart mean 20 days?
The 20 counts candles, so the length is set to 20 four-hour candles. Newer prices affect EMA more, while older prices gradually have less influence. They do not suddenly disappear once they are more than 80 hours old.
Why do Keltner channels differ between platforms?
Start with the same asset, timeframe and historical data. Then check EMA versus SMA, whether its length is 20, whether ATR uses 10, how ATR averages earlier movements, and whether the multiplier is 2. The same name can hide different calculations; compare those settings before judging the lines.
The breakout signal appeared. Did the order follow the rule?
For the trade in the chart, check whether candle 24’s closing signal really waited until candle 25 to submit the buy, then inspect its fill price and quantity. In a supported exchange Demo environment, AlgoRover Live lets you inspect a confirmed strategy’s orders, fills and positions to see what happened after the signal. First confirm that the strategy uses the same EMA, ATR and selling rules.