Anchored VWAP: Why Changing the Anchor Changes Your Entry
The same price can sit above one anchored VWAP and below another. Compare the anchors, then trace when a crossing was knowable and when an order could follow.
You draw two anchored VWAP lines on the same chart. Price sits above one and below the other. One view seems to support holding; the other looks weaker. Before adding another line, check where each calculation starts.
Anchored VWAP, or AVWAP, calculates a volume-weighted average from the candle you choose. Move that starting point and you include a different set of trades, which changes the average. First check where each line starts, then look at how price crosses it and when you would buy or sell.
What is anchored VWAP, and how does it differ from VWAP?
Think of VWAP as a trade ledger. You record the price and quantity of each trade, then divide the total amount paid by the total units traded. A trade of 20 units counts more toward that average than a trade of one unit. That is what “volume-weighted average price” means.
A familiar session VWAP opens a fresh ledger each trading session. With anchored VWAP, you choose the first page and can keep adding entries across days. TradingView’s anchored VWAP tool lets you choose that starting candle on the chart.
The ledger records trades that happened during that period. Some buyers have already sold, and the same units may have changed hands repeatedly. The average gives you a price reference; it cannot tell you what every current holder paid.
How to calculate anchored VWAP
Suppose you are using four-hour candles. Give each candle a representative price: (high + low + close) ÷ 3, called its typical price. Multiply that by the number of units traded during the candle. Add those amounts together and divide by the total units. Each candle becomes one line in the ledger.
Combining trades into candle-sized entries can give a slightly different answer from calculating every individual trade. TradingView’s VWAP calculation describes this common approach.
| Candle | Typical price / USDT | Volume / units | Close / USDT |
|---|---|---|---|
| 1 | 100 | 10 | 100 |
| 2 | 102 | 20 | 101 |
| 3 | 104 | 10 | 104 |
| 4 | 103 | 10 | 103 |
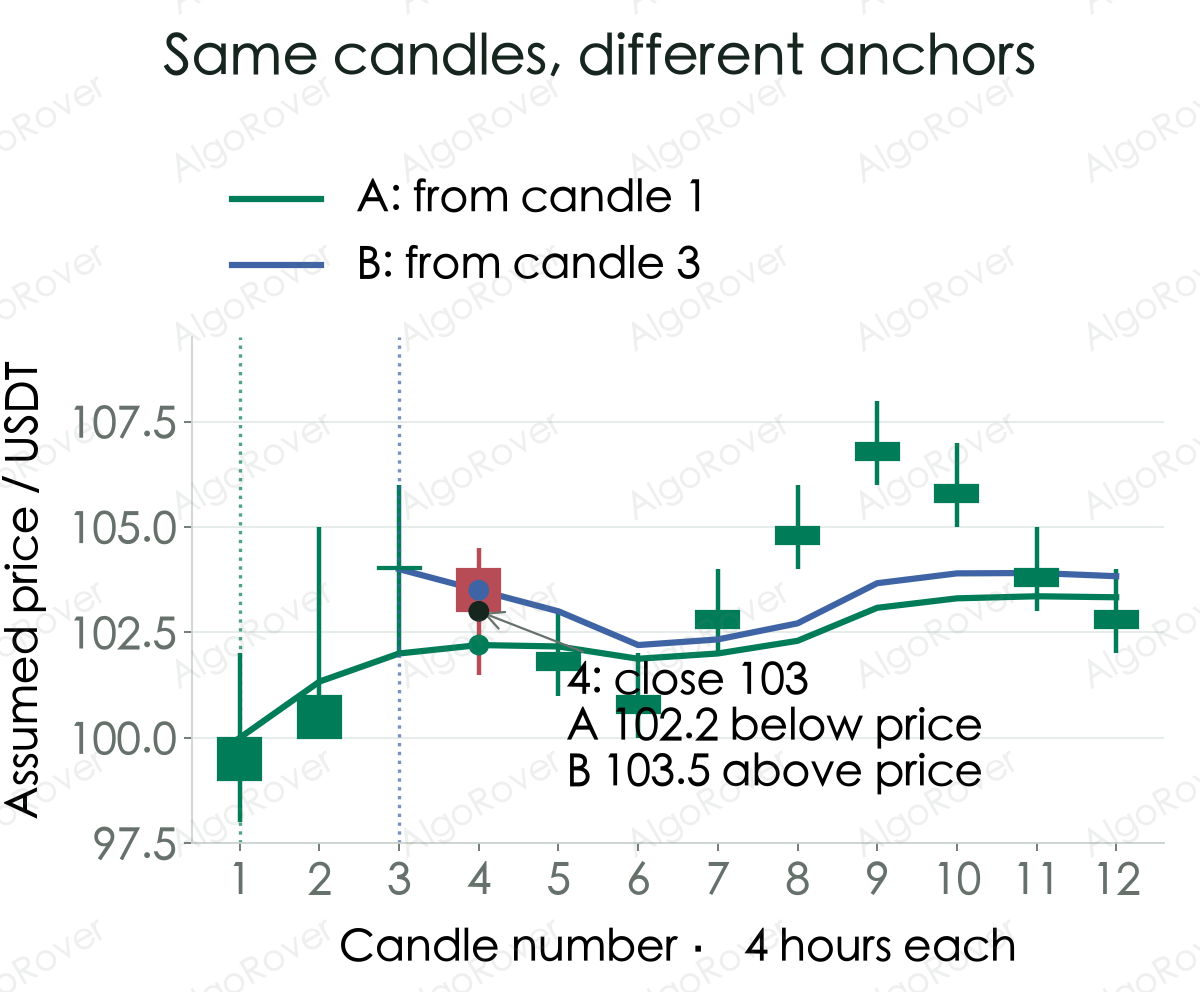
Ledger A starts at candle 1. At candle 3’s close, the average is (100×10 + 102×20 + 104×10) ÷ 40 = 102 USDT. Candle 4 adds 10 units at a representative price of 103. The total amount is now 5,110 for 50 units, giving an average of 102.2.
Ledger B starts at candle 3 and leaves out the first two entries. Its average after candle 4 is (104×10 + 103×10) ÷ 20 = 103.5. Candle 4 closes at 103, above A’s 102.2 but below B’s 103.5. You are comparing the same price with two ledgers that started on different dates.
Where should you anchor VWAP?
A predetermined date, an announcement that has already happened, or a confirmed breakout can define different useful periods. Decide which question you want to answer: the average since the week began, or since a particular event? Record the event, timezone and first included candle.
“Start at the low” sounds reasonable, but when price first drops, how do you know it will not drop further? Suppose your rule requires a candle’s low to be lower than the two candles on each side. After candle 5 appears, you still need candles 6 and 7 to finish before confirming it. You can then backfill the ledger from candle 5, but orders must wait until after confirmation.
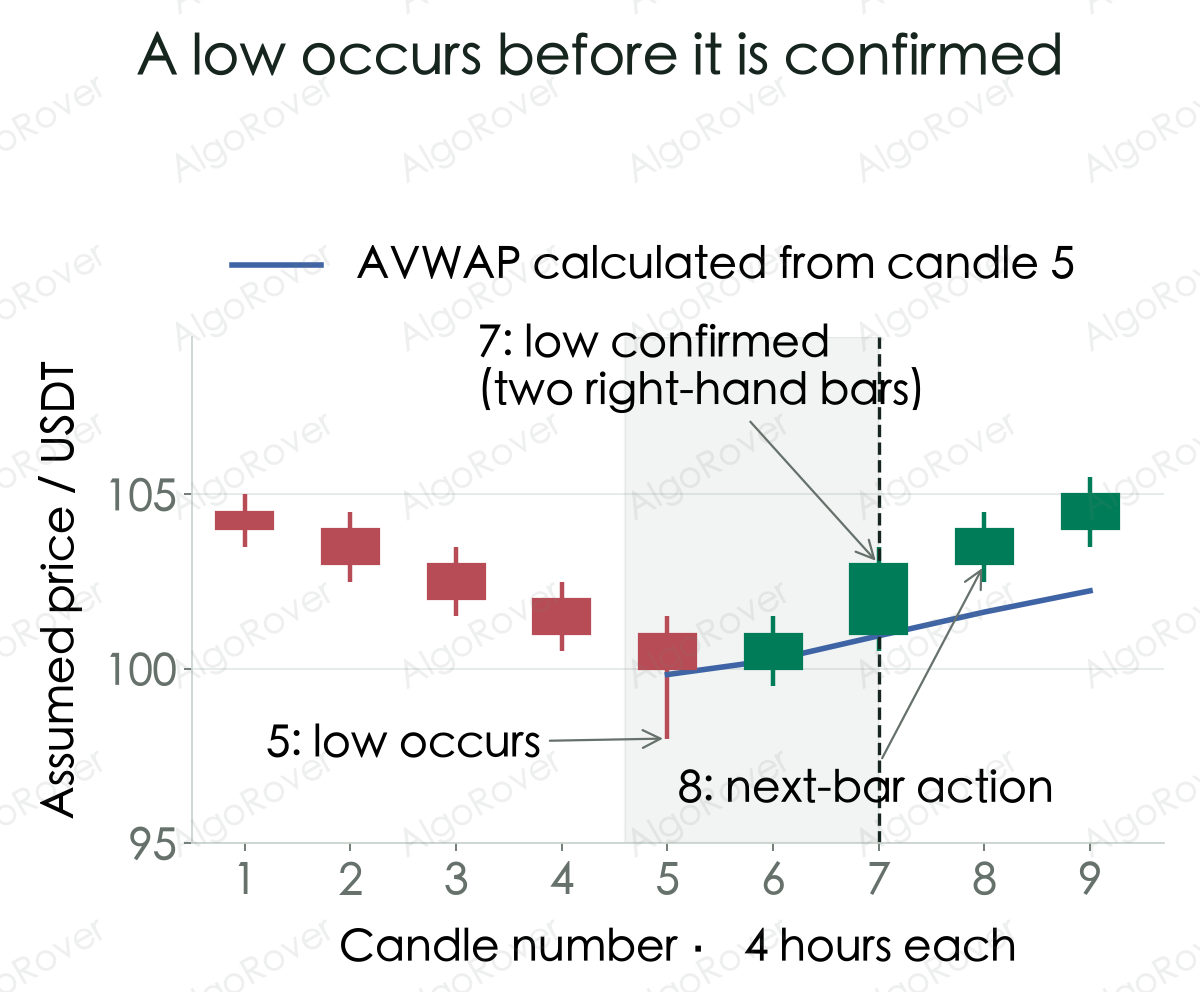
You could instead reset the anchor whenever a new running low becomes known. That is another rule, with repeated resets. A backtest must make each change using only information available at that moment, rather than selecting the most attractive low after seeing the whole chart.
An anchored VWAP crossover strategy, from entry to exit
Return to anchor A in the first chart. Suppose you decide in advance to start the ledger at candle 1 and keep that starting point. You have enough cash to buy one unit and will not add to the position. To check a cross, you need two consecutive candles with both a closing price and a valid AVWAP value.
- While flat, require the previous close to be at or below its AVWAP and the current close to be strictly above its current AVWAP.
- Record the closing signal, then submit the buy at the next candle’s start. The calculation assumes a fill at its opening price, before fees.
- While holding, a close strictly below the current AVWAP schedules an exit at the next candle’s start. Equality does not trigger an exit.
- Remaining above the line does not create another entry every candle. The first value after a new anchor cannot create a crossover without a previous comparable value.
Candle 2 closes at 101, below A at about 101.33. Candle 3 closes at 104, above A at 102, completing the cross. Assume one unit fills at candle 4’s open of 104. Candle 5 closes at 102, below A at about 102.17, triggering the exit. An assumed sale at candle 6’s open of 100.6 loses 3.4 USDT before fees.
A close above an average did not ensure continuation. With anchor B, candle 3 only supplies the first AVWAP reading, so there is no previous value for a cross. Candle 4 then closes below that line. It does not produce the same entry.
A crossover takes two observations: the previous close was below or on its line, and the current close is above its line. If price has already closed above it for three candles, the third candle has not crossed again. Think of stepping over a doorstep versus already standing inside. A program needs that distinction too, or it may try to buy every candle. See how to check whether AI changed your trading rules.
How anchors, timeframe and price source change the result
| Input | What changes? | What should you record? |
|---|---|---|
| Earlier or later anchor | A block of prices and volume enters or leaves the sum; the average can move either way | Time, reason and when the choice became knowable |
| One-hour instead of four-hour bars | Typical prices and volume grouping change, so candle-based values need not match | Data source, timezone and the same starting time |
| Close instead of typical price | The weighted price in every observation changes | Price source, volume units and missing-data handling |
Start with three questions: when does the ledger begin, will you ever open a fresh one, and which exchange supplies the data? Trying every possible anchor and choosing the one that made the most money in the past gives you an advantage you will not have in real time. Decide how you will choose an anchor first, then test it on a period you did not use to make that choice.
When does this crossover rule have room to work?
- ✅ Price crosses and keeps rising: as long as closes stay above the line, this rule can keep holding. The final result still depends on fees and the prices at which orders actually fill.
- ⚠️ Early volume is much larger: once the ledger already contains many units, a few new units barely move the overall average. The line may react slowly. Check whether that old starting point still suits the period you want to understand.
- ❌ Price keeps crossing back and forth: you buy, price drops below the line, you sell, then it rises again. Fees build up with each round trip. Drawing more lines does not automatically fix this.
Keep a record of how you chose the anchor, when it was confirmed, which candle gave the signal, when the order was submitted, and its fill and fees. Those records help explain an unexpected trade. If you add a “buy only when the trend is rising” condition, keep the original result so you can see what the extra condition changed.
Common questions
Anchored VWAP vs VWAP: which is better?
Use session VWAP when you want the average for the current trading session. Anchor it to an announcement or breakout when you want the average since that event. It is like choosing which pages of the ledger to read. To compare trading rules, use the same asset, fees and position size.
Does anchored VWAP repaint?
Keep the starting point and original data unchanged, and values for completed candles stay as calculated. New trades extend the line forward. The unfinished candle can still change because its entry is not complete. If older values change too, check for revised data, an automatic anchor reset, or a newly confirmed low that caused the line to be drawn back to an earlier candle.
Why does AVWAP differ between crypto exchanges?
Each exchange has its own trade ledger, so prices and quantities can differ. First check that you are comparing the same spot or perpetual market, candle interval, timezone and anchor. Then check the price formula and whether volume means units traded or USDT traded. Any of these differences can change the line.
What happens with zero volume?
If the ledger already contains trades, a candle with no new volume leaves the average unchanged. If no units have traded since the anchor, there is no average yet; wait for a trade. Filling that gap with zero could make a program think price crossed a line at zero.
Price crossed above the line. Did the strategy buy on time?
For this trade, candle 3’s close confirms the cross. Check whether the buy waited until candle 4 to be submitted, then look at how many units filled and what you paid. In a supported exchange Demo environment, AlgoRover Live lets you inspect a confirmed strategy’s orders, fills and positions. Compare those records with the strategy’s logged anchor and signal times to check that it kept using the same ledger as your chart.