EMA Warm-Up: Why Trading Signals Can Change After a Restart
The settings stayed the same, but the buy signal disappeared after a restart. Check where the history begins and how the first EMA value is calculated.
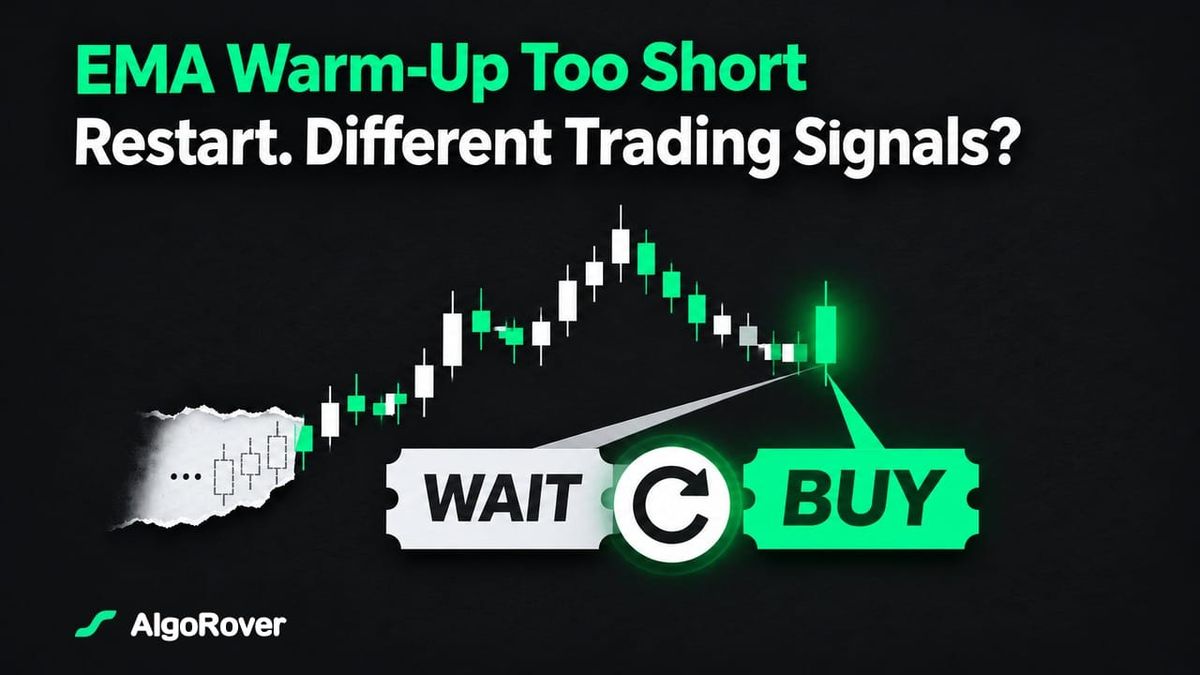
You restart a trading bot without changing the strategy, yet its EMA moves to the other side of the entry threshold. Yesterday's buy signal disappears on the same candle. The missing ingredient may be the history loaded at startup: an EMA remembers where it began. How much warm-up does it need, and how do you check that a restart preserves the decision?
Why can the same EMA period produce different values?
An EMA depends on its previous value and initialization, not only its period. A common recurrence is current EMA = α × current price + (1 − α) × previous EMA, with α = 2 / (period + 1). Starting on different dates can produce different initial values. The difference decays as new prices arrive; reaching N candles does not automatically erase it.
Think of a running account balance. Identical transactions today do not produce the same balance if yesterday's opening balances differed. Matching the latest price checks only the latest input.
Platforms may also seed the first EMA differently. In QuantConnect's EMA documentation, the first ready value is a simple moving average, followed by recursive updates. Before comparing platforms, check that first value and the starting candle, not just whether both periods say 20.
How many warm-up candles does an EMA need?
It depends on how your strategy uses the EMA. The starting value, other indicators and how close price sits to a trading threshold all affect the history you need. Once the EMA returns a number, check whether loading more history still changes that number or the trading signal.
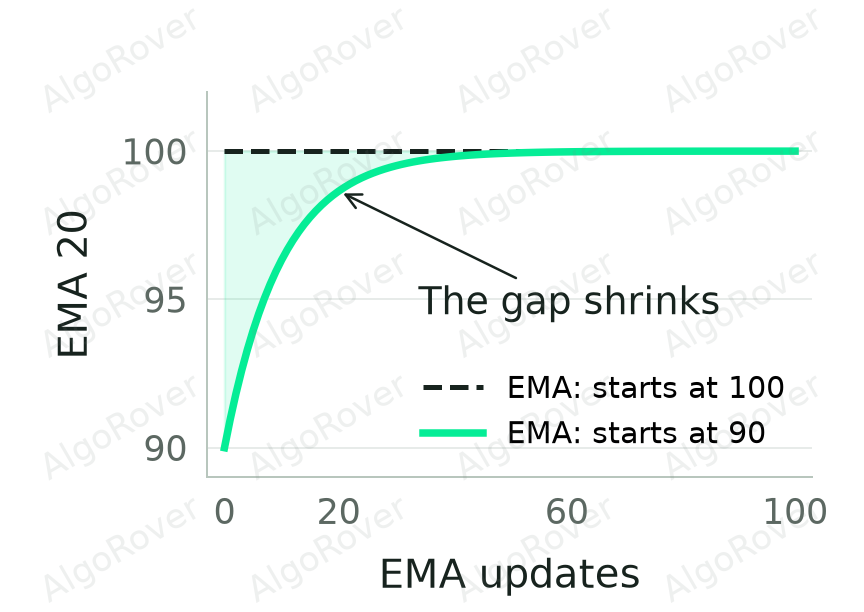
Suppose two EMA 20 calculations start 10 apart, then receive exactly the same prices. Here is how that gap shrinks as new prices arrive:
| Condition | Updates | Remaining difference, approximately |
|---|---|---|
| EMA 20, initial difference 10 | 20 | 1.351 |
| EMA 20, initial difference 10 | 60 | 0.0247 |
| EMA 20, initial difference 10 | 100 | 0.00045 |
These values come from 10 × (19/21)k, where k is the number of updates. The gap keeps shrinking. Whether it is small enough to leave your orders unchanged depends on the signal rule; other indicators in the strategy may need more history too.
Can a tiny indicator difference change a trade?
It can when price is close to the trigger. Suppose price is 100.00 and the EMA comes out at 99.99 in one calculation and 100.01 in another. A “price above EMA” rule triggers in the first case and stays off in the second. A difference of just 0.02 changes the decision.
A crossover also depends on the previous candle. A small difference on the final row does not establish matching crossover times. Compare signal timestamps, first entries and exits as well as indicator values.
What does recursive analysis actually test?
Freqtrade's recursive-analysis compares indicator values under different startup-candle counts. Its documentation explicitly limits the comparison to the final row and says it does not verify entry or exit signals. Treat a low reported variance as an indicator check, then test the decisions themselves.
- Fix the market, timeframe, end time, price field and indicator implementation.
- Compute with several historical starting points and compare the same overlapping period.
- Inspect values near thresholds and compare entry, crossover and exit timestamps.
- Choose a startup length, freeze it and rerun the formal test.
- Save the actual data count, first and last timestamps, and first permitted trading time.
Choose lengths that fit the strategy and available history. Selecting the startup count that gives the prettiest equity curve turns another engineering setting into an optimization parameter.
What else should you check after a restart?
Compare the same closed candle first. Then inspect missing or duplicate candles, timezones, price fields, revised data, and whether historical and live events reach the indicator in chronological order. An unfinished candle changing in real time is a different problem from initialization.
Record four boundaries: data loading begins, indicators become ready, trading is permitted, and performance measurement begins. Warm-up history may precede the test; it should not silently change the intended evaluation period.
How do you make startup conditions reproducible?
Save periods, historical start, initialization method, warm-up count and trading start. AlgoRover Research can help organize the historical research. Keep those settings with the strategy version when moving to execution so a restart does not quietly change the starting conditions.
For a closer look at how signals lead to trades, see EMA crossovers and ATR exits. After a restart, pick a few matching candles and compare the values and decisions. That gives you somewhere concrete to start looking.
Frequently asked questions
Are 200 candles enough for EMA 200?
Having a value does not establish convergence. Compare different history lengths at the same end time and inspect both indicators and signals.
Is a longer warm-up always better?
More history generally reduces initial-value influence but requires more data. Look for a stable, reproducible configuration rather than a return-maximizing count.
Does zero recursive variance prove matching live signals?
No. A final-row comparison does not validate every decision, data timestamp or execution setting.
Why do two platforms calculate different EMAs?
Compare seeds, price fields, date ranges, live versus closed candles and missing-data rules before attributing the difference to precision.
Did the restart change the orders too?
After checking the EMA difference, run the same version and configuration in AlgoRover Live. Compare signals and order records before and after the restart to locate where the trading decision changed. Start in a supported exchange Demo.
Sources
Not investment advice.