Same strategy, better returns in 30 days than in a full year. Why?
Earlier losses can offset recent gains, while a fresh backtest resets capital and positions. Compare the account path before comparing 30-day and full-year returns.
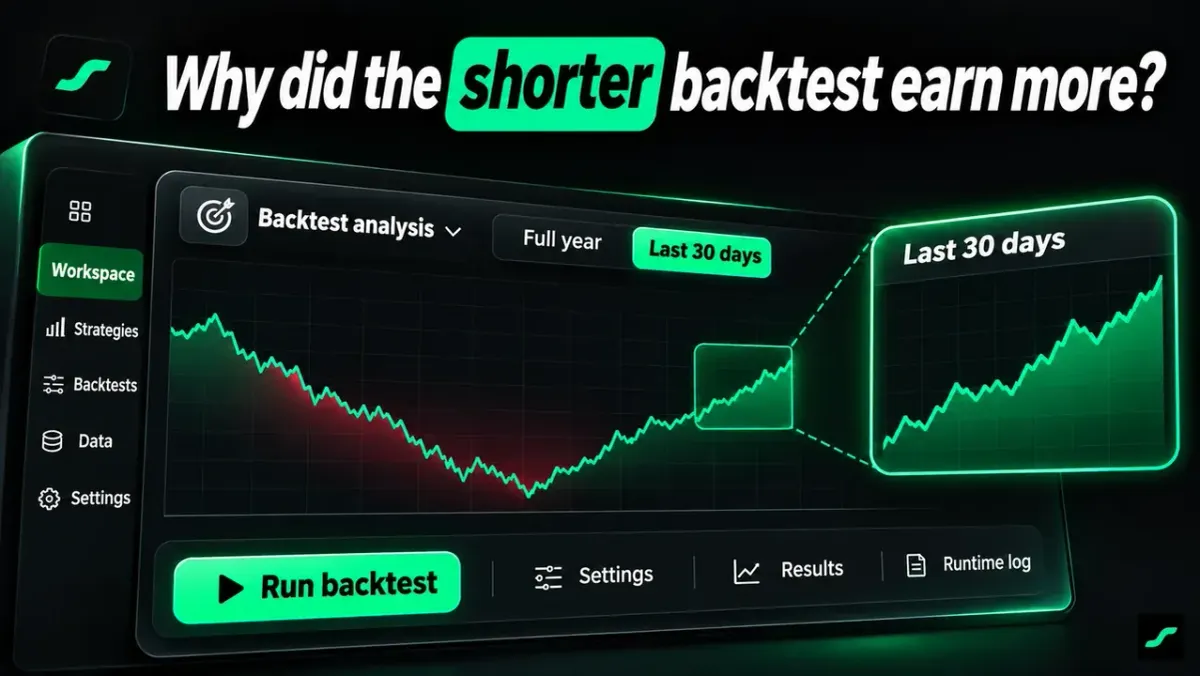
Your strategy made more in the last 30 days than across the whole year. Start with two checks: did earlier losses offset the recent profit, and did both backtests enter that month with the same capital and positions? A fresh 30-day run starts a new account path. The full-year run arrives with its earlier gains, losses and open trades already attached.
In strategy backtesting, compare 30-, 90- and 365-day results against the same strategy revision, market, bar interval and cost assumptions. In AlgoRover, keep those settings beside the results. Cumulative return, annualized return and monthly performance answer different questions; the report becomes useful when each number has a clear meaning.
Is the difference caused by earlier losses or a different starting state?
I tested the same strategy over 30, 90 and 365 days. The last 30 days look better than the whole year. Is the report wrong?
First break the full-year run into months. Earlier losses may have offset the last month's profit. Then check the end date, strategy revision, instrument, bar interval, fees, slippage and initialization settings across the independent runs.
The 30-day backtest may start flat. The full-year account may enter the same date holding a position, or with more or less capital. Even on the same price bar, those accounts can place different orders.
Can you add short backtests together to reproduce a full year?
Can I add the short-period returns to recover the annual result?
Check whether every segment refills the account, clears positions and resets state. If so, you are combining separate fresh-start experiments.
A continuous account also compounds. In this illustrative example, capital rises 10% and then falls 10%: 100 becomes 110, then 99. The combined return is −1%.
| Stage | Capital | Calculation |
|---|---|---|
| Start | 100 | Common starting point |
| First segment: +10% | 110 | 100 × 1.10 |
| Second segment: −10% | 99 | 110 × 0.90 |
| Combined return | −1% | 99 ÷ 100 − 1 |
So to explain annual performance, I should use the data from that annual run?
Yes. Split its equity curve and fills into months while preserving positions carried across month-end and the associated costs. Keep independent short windows in a separate comparison.

Why does a 5% return over 30 days become about 81.1% annualized?
The account only gained a little in a month. Why is the annualized figure so much higher?
Annualization scales a period's return to a one-year equivalent. A common daily-compounding formula is (1 + period return) raised to (365 ÷ days), minus 1.
For a 5% gain over 30 days, 1.05 raised to 365/30, minus 1, is about 81.1%. The observed test still covers 30 days, with a 5% period return.
Should I put the period return and number of days beside the annualized return?
Add completed trades and maximum drawdown. Also check the report's annualization definition: another report may use trading days or a different convention.
Ask AI to compare periods, costs and drawdowns
This separates fresh-start window tests from monthly changes in one continuous run. Differences can then be traced to market conditions, the position path or cost settings.
Backtest periods and annualized returns: common questions
How should I choose a backtest period for a fair comparison?
Define the question first. Fix the strategy version, instrument, interval, end date, starting capital and cost assumptions. Separate independent starting-date tests from monthly segments of the same continuous run.
Can starting capital and existing positions change backtest returns?
Yes. Equity-based sizing changes subsequent order amounts as capital changes. Positions carried into a period also affect entries and exits. Record the starting state alongside the return.
Does a high short-term annualized return mean the strategy is better?
Read it alongside the actual period return, completed trades, maximum drawdown, fees and slippage assumptions. Annualization converts a sample; it does not extend that sample's observed history.
Do stronger 30-day results prove backtest overfitting?
A difference between windows alone does not establish overfitting. If the same data was repeatedly used to select parameters and judge them, add out-of-sample testing on unused data and compare different market conditions.